A simple flowchart representing a process for dealing with a non-functioning lamp.
Flowcharts are very commonly used in product prototype documents. They’re very helpful for me to understand the process. This is a simple article that how I understand Flowchart.
Elements/ Components
Most important elements in flow charts are:
- Round rectangular box, which is the start state
- The rectangular box stands for a processing step, usually called
activity - Diamond is a decision
- Parallelogram indicates the process of inputting and outputting data
- Flows are noted as lines with arrows
When to use
- Document a process
- Present a solution
- Brainstorm an idea
- Design a system
- Explain a decision making process
- Store information
Tools
- MS Visio, only on Windows
- OmniGraffle, available on Mac
- An online tool, Processon
- Another online tool, Draw.IO
- A new option, Zen Flowchart
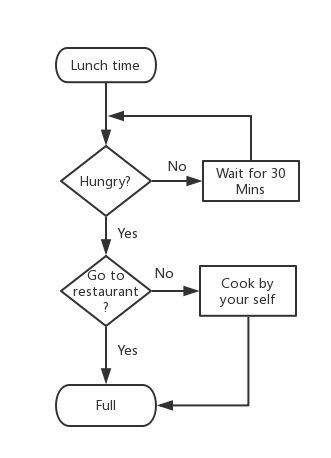
Demo
Here is a simple demo I made. It’s lunchtime now. Are you hungry? If no, you can wait for 30 minutes, and ask whether you’re hungry again. If yes, you’re hungry, you can choose to go to restaurant or cook by yourself. After having lunch, you will be full.